Executive Summary
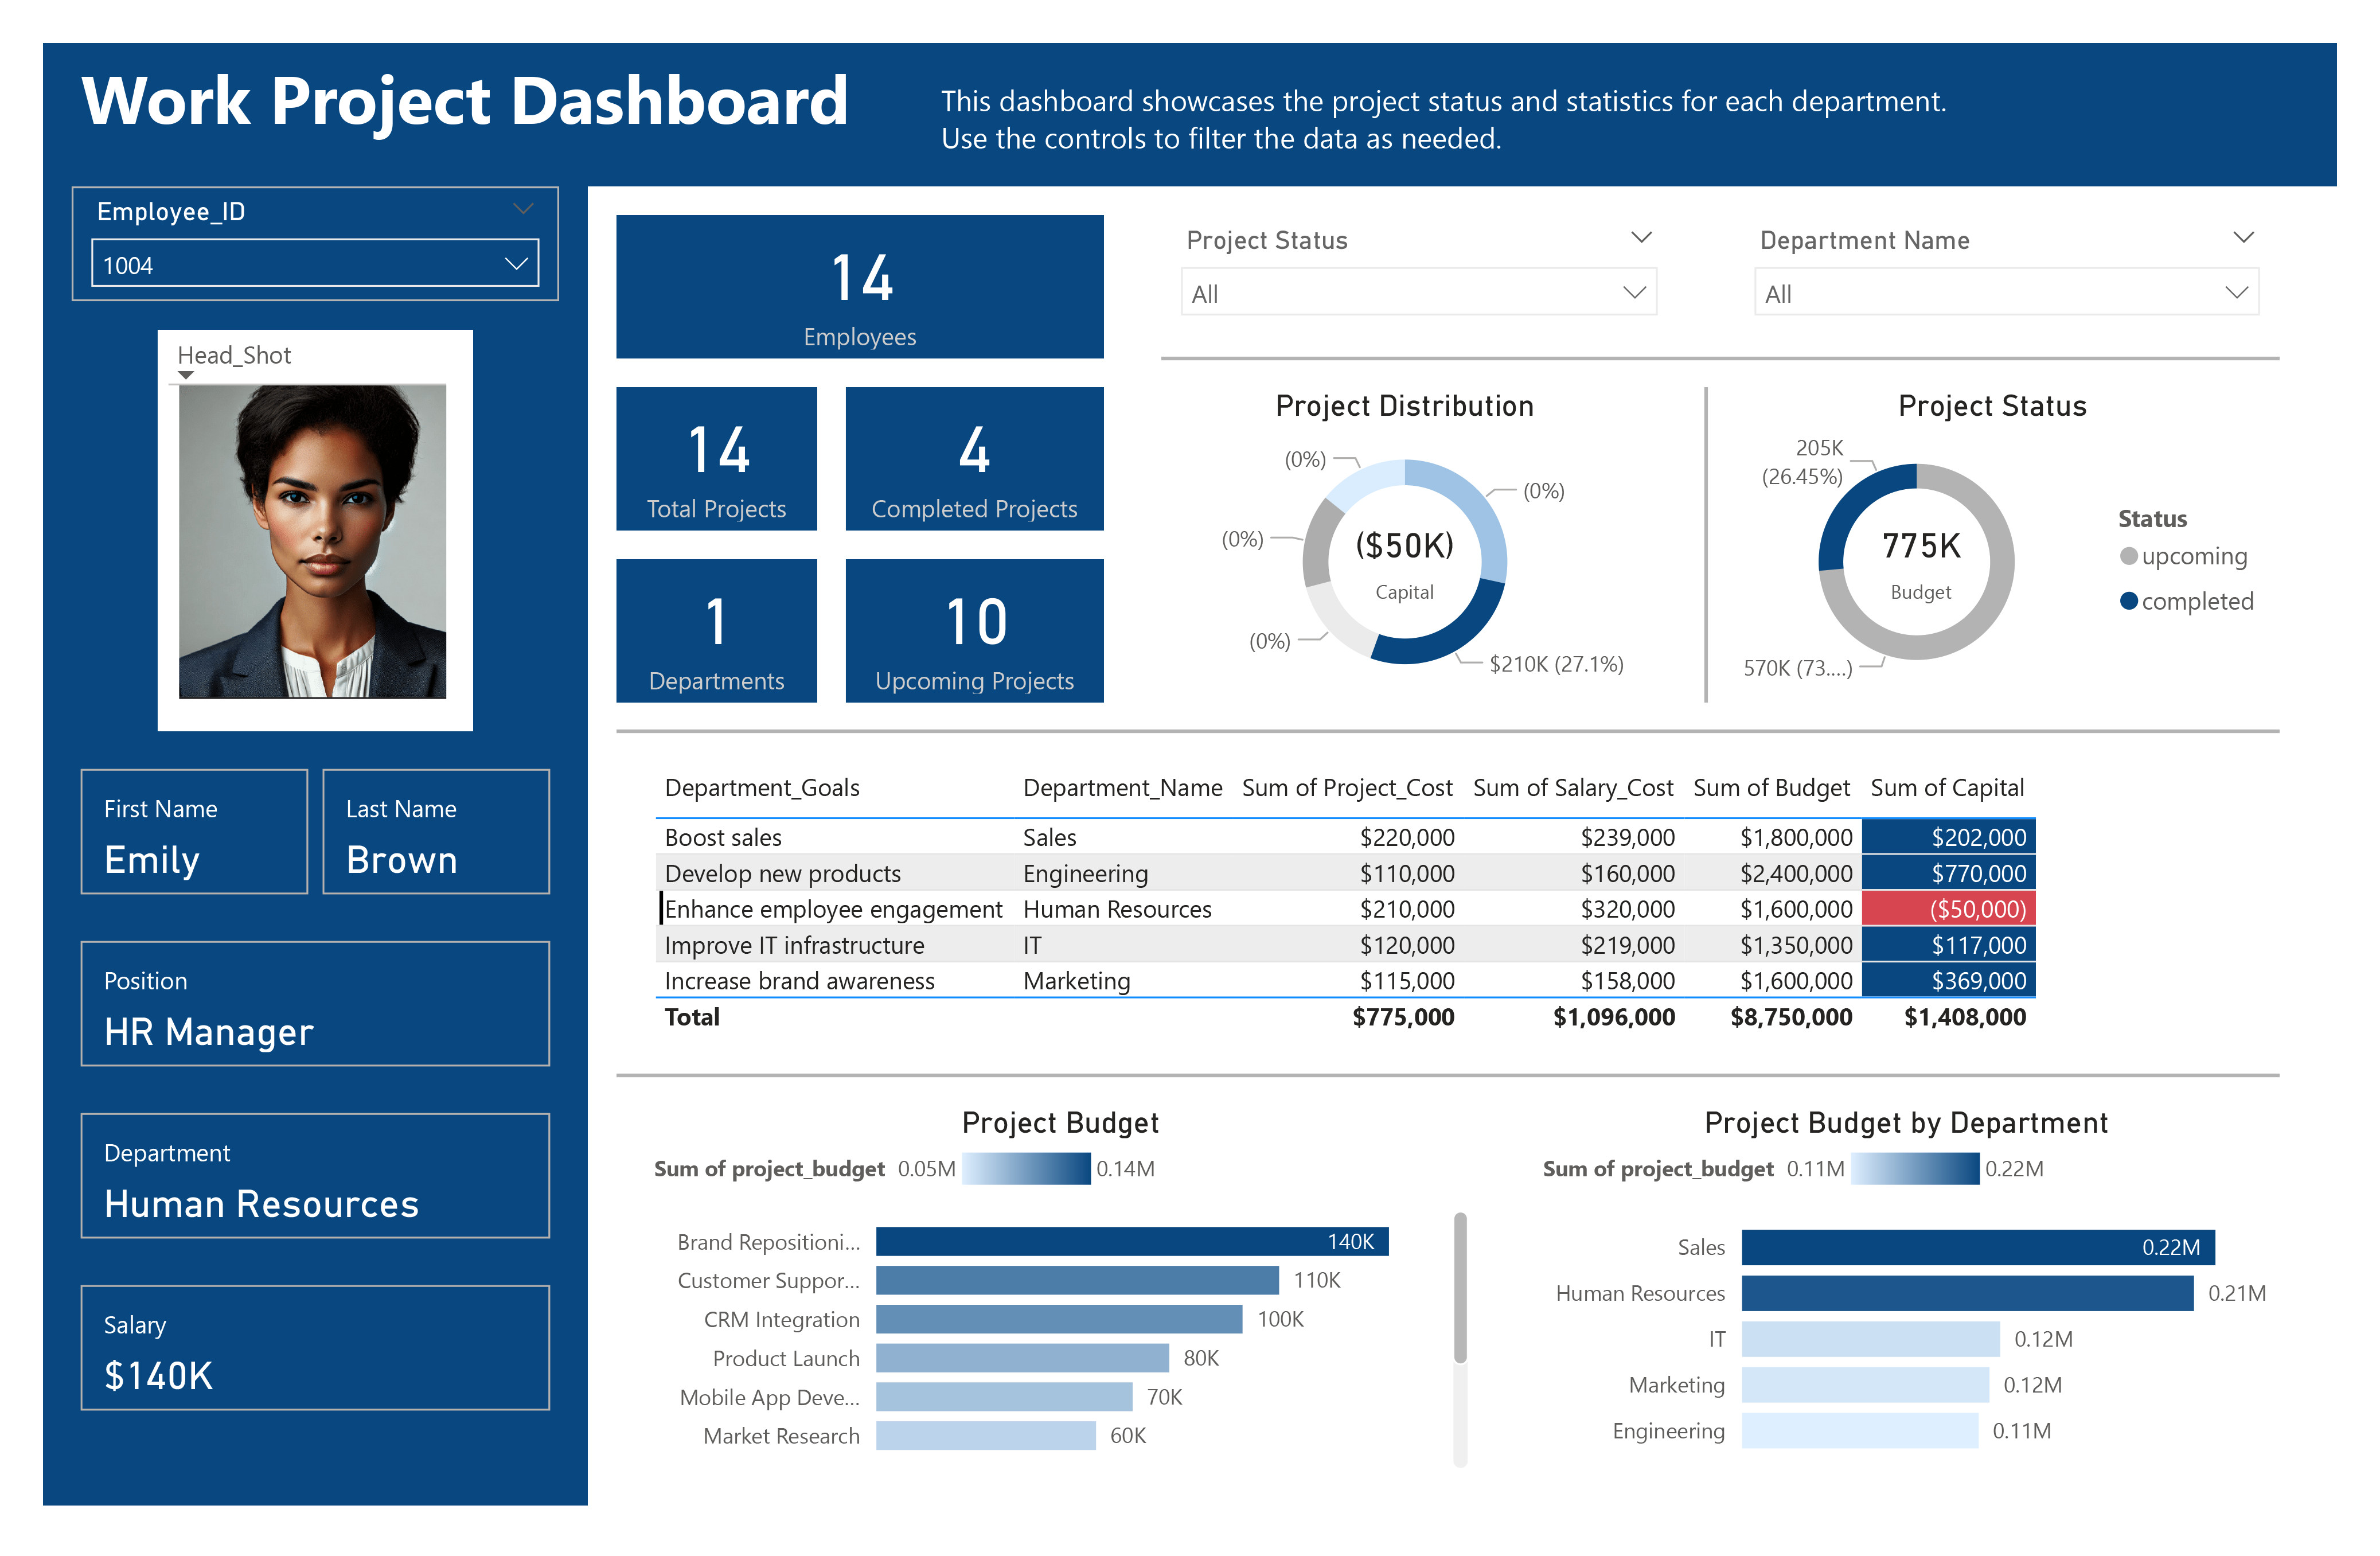
This Power BI dashboard provides real-time visibility into Quanta Technologies’ workforce costs, project budgets, and departmental performance. Key findings reveal:
- Human Resources is $50K over budget due to high salary costs relative to project returns.
- Engineering has the highest capital expenditure ($770K) but aligns with its “Develop new products” goal.
- 10 upcoming projects (vs. 4 completed) indicate a busy pipeline, with Sales and HR dominating budget allocations.
Key Insights
1. Departments at Financial Risk
| Department | Budget | Salary Cost | Project Cost | Capital | Status |
|---|---|---|---|---|---|
| Human Resources | $1.6M | $320K | $210K | ($50K) | ❗ Over budget |
| Engineering | $2.4M | $160K | $110K | $770K | ✅ On track (R&D focus) |
| Sales | $1.8M | $239K | $220K | $202K | ⚠️ Monitor project ROI |
Risk Analysis:
- HR’s salary costs (320K)exceedprojectreturns(210K), creating a $50K capital deficit.
- Sales projects consume 12.2% of total budget but lack visibility into ROI (e.g., “Brand Repositioning” at $140K).
🔹 Recommendation:
- Audit HR’s high salary spend (e.g., overtime, headcount).
- Tie Sales budgets to revenue targets (e.g., CRM Integration’s impact on conversions).
2. Project Budget Allocation
Top 3 Projects by Budget:
- Brand Repositioning ($140K | Marketing)
- Customer Support Upgrade ($110K | Sales)
- CRM Integration ($100K | Sales)
Concerns:
- 70% of projects are “upcoming”—potential for scope creep or delays.
- No clear link between budgets and department goals (e.g., Engineering’s 770Kcapitalvs.110K project spend).
🔹 Recommendation:
- Implement quarterly budget reviews to align project spend with annual goals.
- Add KPIs to track project health (e.g., timeline adherence, deliverable quality).
3. Workforce Cost vs. Productivity
- HR has the highest salary cost ($320K) but the lowest capital return.
- Engineering achieves high capital output (770K)withmoderatesalaries(160K)—a model for efficiency.
🔹 Recommendation:
- Cross-train HR staff to support revenue-generating projects (e.g., hiring for Sales/Engineering).
- Reallocate surplus Engineering capital to underfunded IT infrastructure projects.
Dashboard Features
✅ Interactive Filters: Drill down by department/project status.
✅ Budget vs. Actuals: Color-coded alerts for overspending.
✅ Employee-Level Data: Track roles, salaries, and departments (e.g., Emily Brown, HR Manager, $140K).
Strategic Recommendations
- Mitigate HR’s Budget Deficit:
- Freeze non-essential hires or shift tasks to lower-cost roles.
- Optimize Engineering’s R&D Spend:
- Allocate 200Kofits770K capital to IT infrastructure upgrades.
- Enhance Project Governance:
- Add a “Risk Score” metric to the dashboard for upcoming projects.
Conclusion
This dashboard highlights actionable cost-saving opportunities while ensuring strategic projects stay on track. Next steps:
- Integrate revenue data to measure project ROI.
- Automate alerts for budget thresholds.
