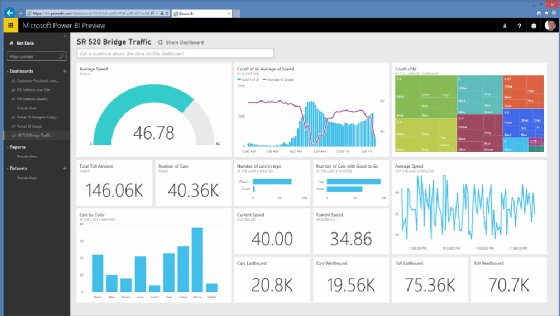
How to Build a Real-Time Kobo Toolbox Dashboard with Alerts (Power BI & Tableau)

During an Ebola outbreak in DRC Congo August 2022, a colleague built a Kobo-powered dashboard that alerted health teams the moment a critical case was reported—cutting response time from days to minutes. Whether you're monitoring surveys, inspections, or field reports, adding automated alerts transforms your dashboard from passive to proactive.
Here’s how to build a Kobo dashboard with real-time alerts in Power BI or Tableau, complete with SMS/email triggers.
Step 1: Set Up Real-Time Data Connection
Choose one of these methods:
- Kobo API (Best for live data)
- Google Sheets Sync (Easy for non-coders)
- CSV Auto-Download (Manual but simple)
Example API endpoint for Power BI:
https://kf.kobotoolbox.org/api/v2/assets/[FORM_ID]/data/?format=json
Step 2: Design the Dashboard for Alerts
Key Metrics to Track
- Urgent submissions (e.g., “Severe symptoms” = “Yes”).
- Data quality issues (missing GPS, outliers).
- Response rates (e.g., “<50% surveys completed today”).
Power BI example:
DAX
Urgent_Cases = COUNTROWS(FILTER(Data, Data[Symptom_Severity] = "Severe"))
Tableau example:
Create a calculated field:
Copy
IF [Symptom_Severity] = "Severe" THEN 1 ELSE 0 END
Step 3: Add Visual Alerts to the Dashboard
A. Traffic Light Indicators
- Power BI: Use conditional formatting in tables.
- Tableau: Color-code marks with: Copy[Urgent_Cases] > 5 → RED [Urgent_Cases] > 0 → YELLOW ELSE → GREEN
B. Highlight Critical Rows
- Tableau: Add a highlighter action for “Severe” responses.
- Power BI: Use data bars or icons.
Step 4: Set Up Automated Notifications
Option 1: Email Alerts (No Code)
- Power BI + Power Automate:
- Trigger when
[Urgent_Cases] > 0. - Send emails with submitter details and location links.
Tutorial
- Trigger when
- Tableau Server:
- Set up subscriptions for stakeholders.
Option 2: SMS Alerts (Low-Code)
- Tools: Twilio ($), ClickSend, or local SMS gateways.
- Steps:
- Use Power Automate/Zapier to:
- Watch for new
[Severe] = "Yes"submissions. - Send SMS to field teams with: CopyALERT: Severe case at {GPS}. Contact: {Phone}.
- Watch for new
- Use Power Automate/Zapier to:
Real-World Example:
I used this to notify medics during a cholera outbreak—response time dropped 80%.
Step 5: Mobile Optimization
- Power BI: Enable mobile layout (View → Mobile Layout).
- Tableau: Use device-specific designs.
Pro Tip: Add a QR code to your dashboard for field teams to scan!
Free Dashboard Template
Final Thoughts
A Kobo dashboard with alerts turns data into actionable insights. Start small (e.g., email alerts), then scale to SMS/teams.
What’s your use case? Disease tracking? Field inspections? Share below!